This blog attempts to be a collection of how-to examples in the Microsoft software stack - things that may take forever to find out, especially for the beginner. I see it as my way to return something to the Microsoft community in exchange for what I learned from it.
My Dell Venue 8 Pro that I primarily use as an e-reader was the last of the flock to get the update... so after gone trough the plight of getting about 8GB of data free to be able to actually start the Fall update... it got stuck at 40%. Twice, actually. It was installing a whole night but never passed 40%.
The root cause appeared to be an SD card. The fix is pretty easy.
Hold the power button till your DV8P powers down
Once it has shut down, pop out the SD card
Power it up again.
It will now restore your previous version of Windows, that is, the Windows 10 RTM 10240. Wait for that complete (should be a few minutes)
Follow this procedure as described by Rod Trent on the SuperSite for Windows
The update will now complete (fingers crossed)
Once it's done, login and pop in your SD card again.
At the original writing of this article I was thinking "I have read this somewhere before, but where"? Neither Google or Bing yielded any results. The odd thing is my Surface Pro 1 upgraded flawlessly, although it does have SD card too.
Maybe I did not search thoroughly enough, because a day later the writer of this blog (in Dutch) pointed out he posted the same thing before I did. The post recounts a twitter conversation between Gabe Aul and Mary Jo Foley about popping the SD card on upgrade. I probably have seen the conversation in my timeline and subconsciously registered it. I admit prior art ;) but I will leave this post up because I think it makes the solution easier to find.
Since my first forays into Xamarin I have been making great use of this awesome trick by Scott Hanselman to quickly change from a configuration with Hyper-V (for Windows Phone and Windows 10 Mobile development) and Virtual Box (for using emulators based upon VirtualBox. I created this dual-boot option in Windows 8.1, and it survived the upgrade to Windows 10 RTM 10240 in July.
After updating to the Windows 10 Fall update (aka 1511, aka 10586.3) I found out I had two boot option in my boot screen - "Windows 10" and "Windows 10", both with Hyper-V enabled.
Bummer.
Fortunately, this is easy to fix.
Open an admin command prompt
Enter bcdedit. You will get a list of three entries, the first one "Windows Boot Manager" (ignore that) and two called "Windows Boot Loader"
Check that both have an entry "hypervisorlaunchtype" set to "Auto"
Both boot loaders description "Windows10" and will have an identifier. One will be a {current}, the other a GUID like identifier, like {3bca20f3-367f-11e5-9da7-f5ee60b7b905}. That is the one you can change.
Enter bcdedit /set {your-guid-here} description "No Hyper-V"
Enter bcdedit /set {your-guid-here} hypervisorlaunchtype off
If your reboot now, you will once again have two options, one with description Hyper-V, the other still called Windows 10
Caveat emptor: playing around with the boot editor can seriously mess up your system. Be sure of what you are doing. Even I usually stay away from this as much as possible. Worked on my machine - I cannot accept any responsibility for it not working on yours :)
Intro In this final episode of the planned series, posted on "Back to the Future" day, I will show you how to use external map sources and how to use them with the Windows 10 maps control. Specifically I will show you how to use Tile Map Services (TMS) - way of distributing digital maps designed by the Open Source Geospatial Foundation and popularized by Google Maps - and Web Map Services (WMS), and older, more complex protocol designed by the Open Geospatial Consortium in 1999.
I am using TMS in a loosely defined way here - I am defining it as a REST-based system that retrieves pre-rendered tiles of maps using fixed zoom levels based on zoom level and location (try to say that without stuttering). A TMS basically is a take-it-or-leave-it approach - you get a map rendered as the maker saw fit, whereas WMS offers you the possibility to select layers and determine the order in which those layers are retrieved - and sometimes they even support custom styling. In addition, it allows for arbitrary image sizes, whereas TMS typically services 256x256 images. TMS typically comes from a file system containing a very large number of small files, whereas a WMS is typically served from a spatial database. Consequently, WMS, while being more versatile, usually is a lot slower.
So what is this all about? The are a very large number of servers out there that offer you maps that you can use - OpenStreetmaps, Google, NOAA, but also our own Dutch Rijkswaterstaat - a government agency that maintains the Dutch main road and water transport infrastructure. You can search for public endpoints of those servers, and when you implement a little code to translate the requests of you Windows 10 map control into the right URLs, maps will show up.
The sample code will show you how to use the following data:
Google Maps
OpenStreetMaps (a non-profit organization that has insanely detailed maps) - I use it often when I go on hiking holidays in Germany or the like, as even the most obscure hiking trails are displayed in more detail than any tourist map you can buy.
Dutch Rijkswaterstaat maps
NOAA weather and cloud maps
Be sure to read up on the terms of services of the map providers. Not every one of those providers have unlimited bandwidth or CPU power to serve up the needs of your app, or they may require you to pay for that. OpenStreetMaps is a non-profit organization that does not like you to let their servers burn. Some, like Google, require you to use their API in stead of directly accessing the URLs where their data reside. The sample code used in this project violates this TOS of Google, and is intended as an educational sample only. I strongly advise you not to use this in production environments - and to be honest, the HERE maps data is so good in most of the cases there is little need for doing that.
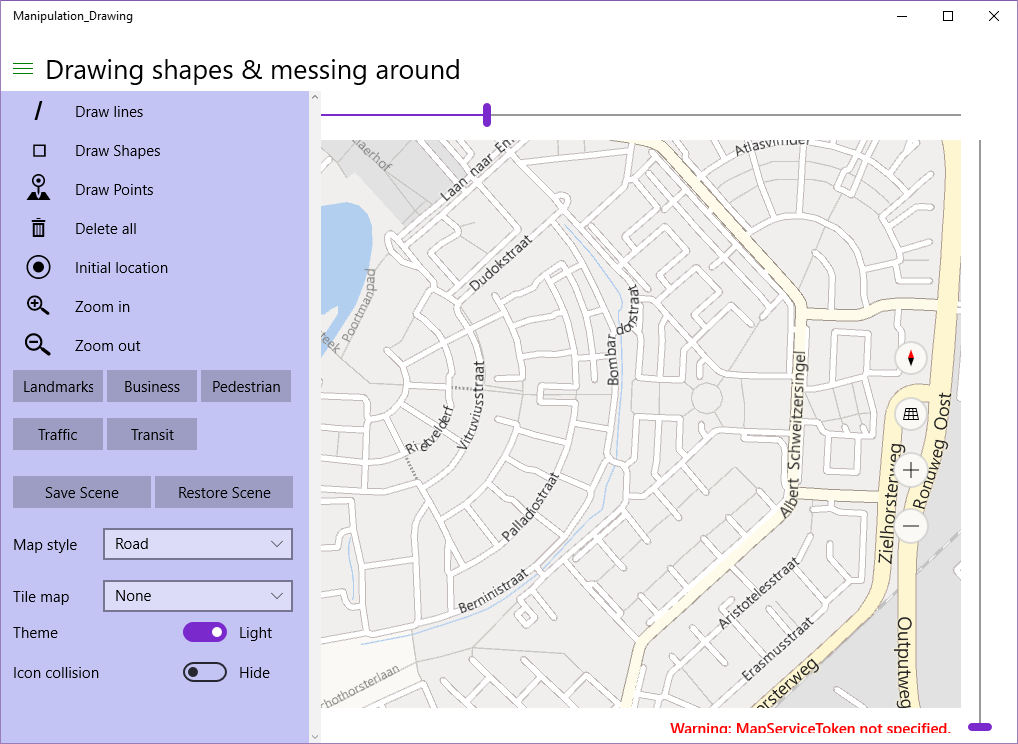
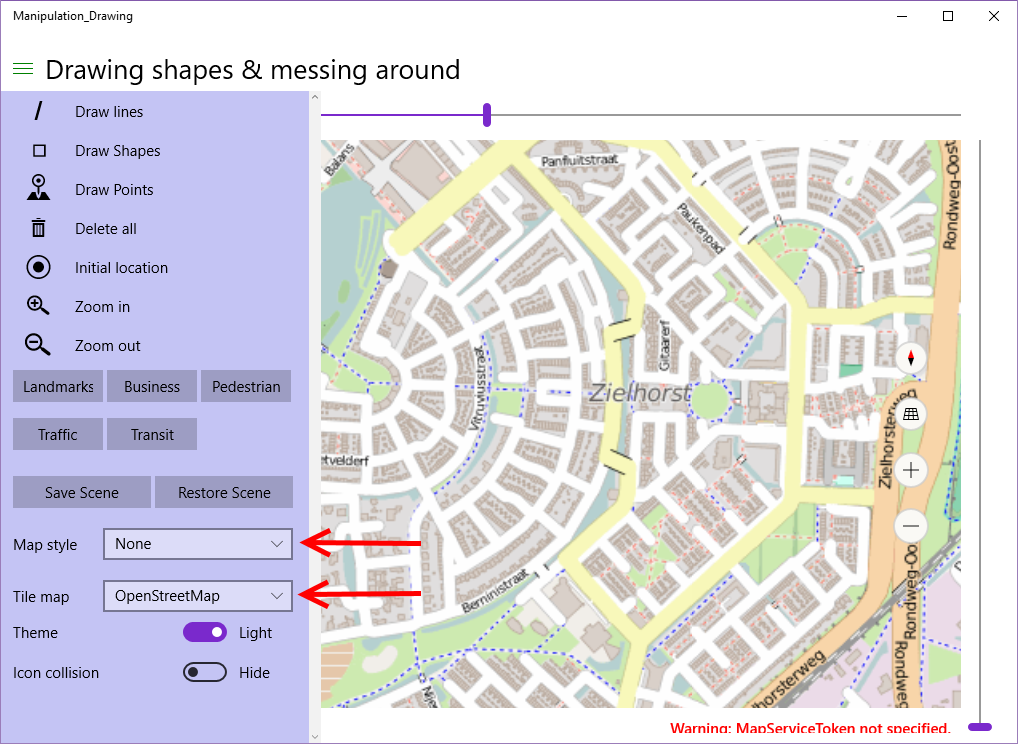
Viewing the demos Start the app, click "Initial location". You will see this. Now select "None" for Map style (the map will turn black), then select "OpenStreetMap" for Tile Map. The map will turn into as displayed below, and already shows some blue dotted hiking trails - even through the very neck of the woods where I live.
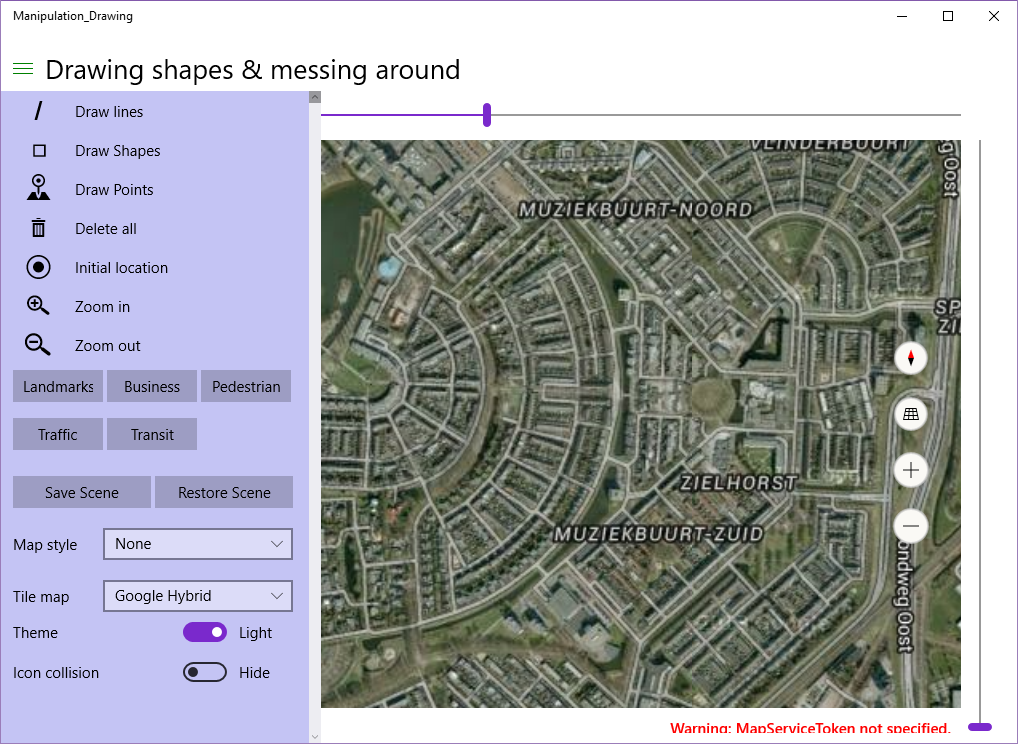
If you select Google Hybrid you will get the Google Satellite imagery with street labels on top of it. Once again, this is illegal, but it proves my point:
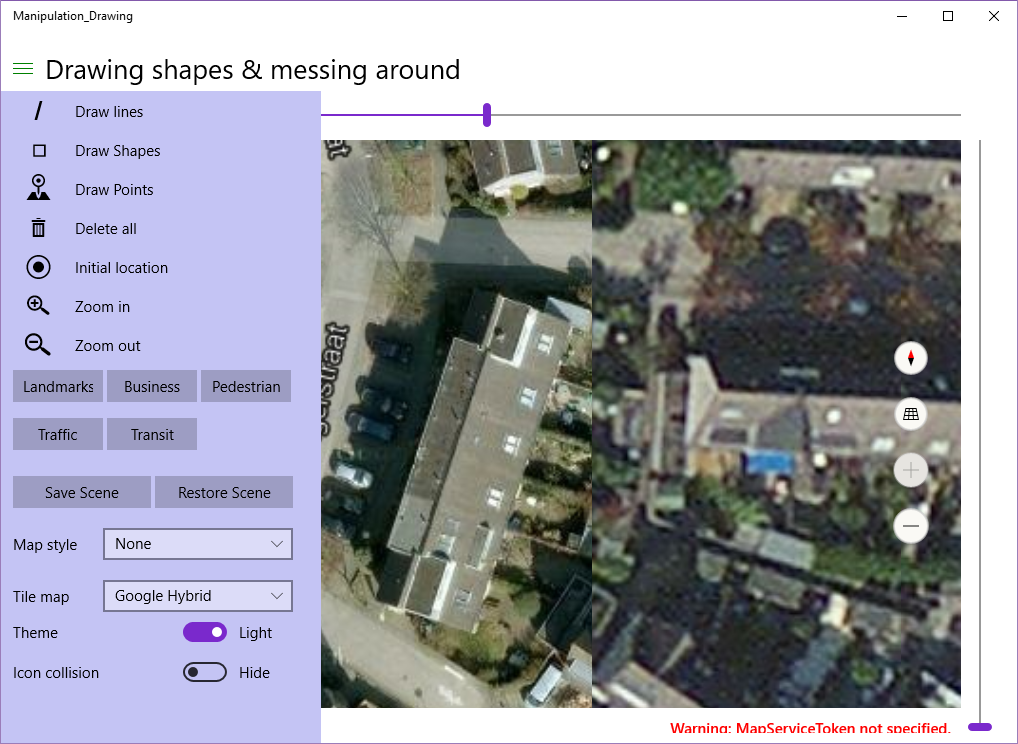
And why this might be useful... if you zoom all the way in and put the Google and Here imagery next to each other you will see that Google imagery in some places still has some more detail, although it's very outdated - my neighbor's house extension is not visible yet (it is on Here Maps) and I am now driving the 2nd car after the car that is still in front of my house - putting this back to the early days of 2009 at the very latest.
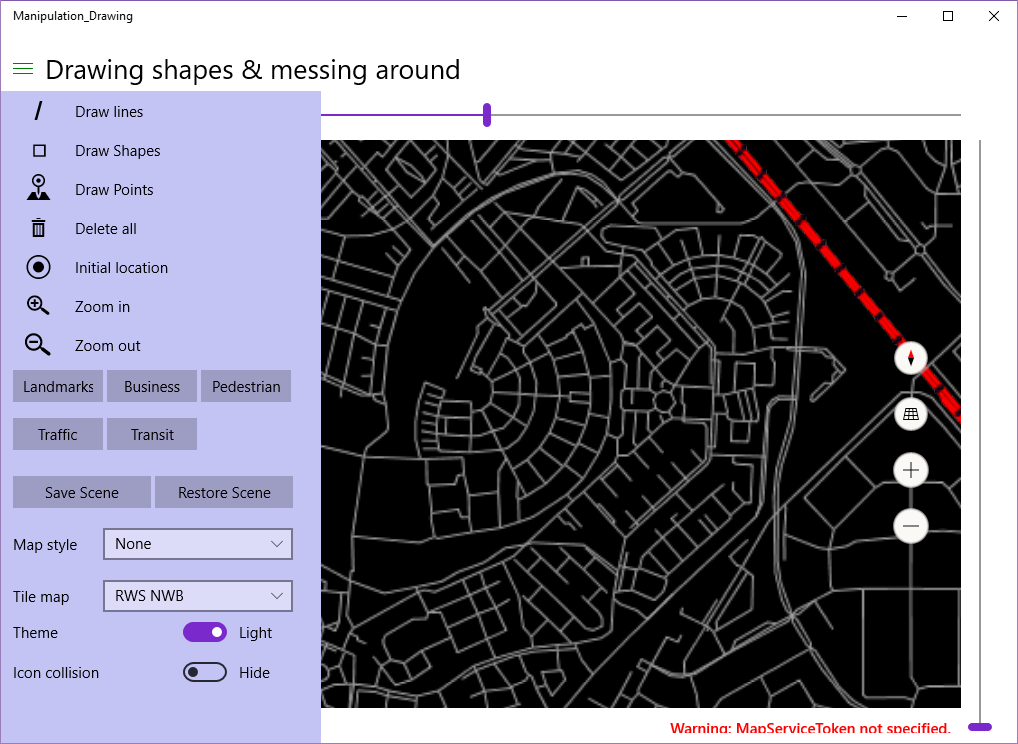
If you zoom out a little again, and select "RWS NWB" you will see the national road grid map from the Dutch Rijkswaterstaat, a simple line map for secondary roads, the major highway depicted as double red lines, with black dots showing the location of hectometer signs - the little signs that show you where you are on the roads, and that can be used to specify your location when your cars breaks down and you need to call for help. Amongst other things :)
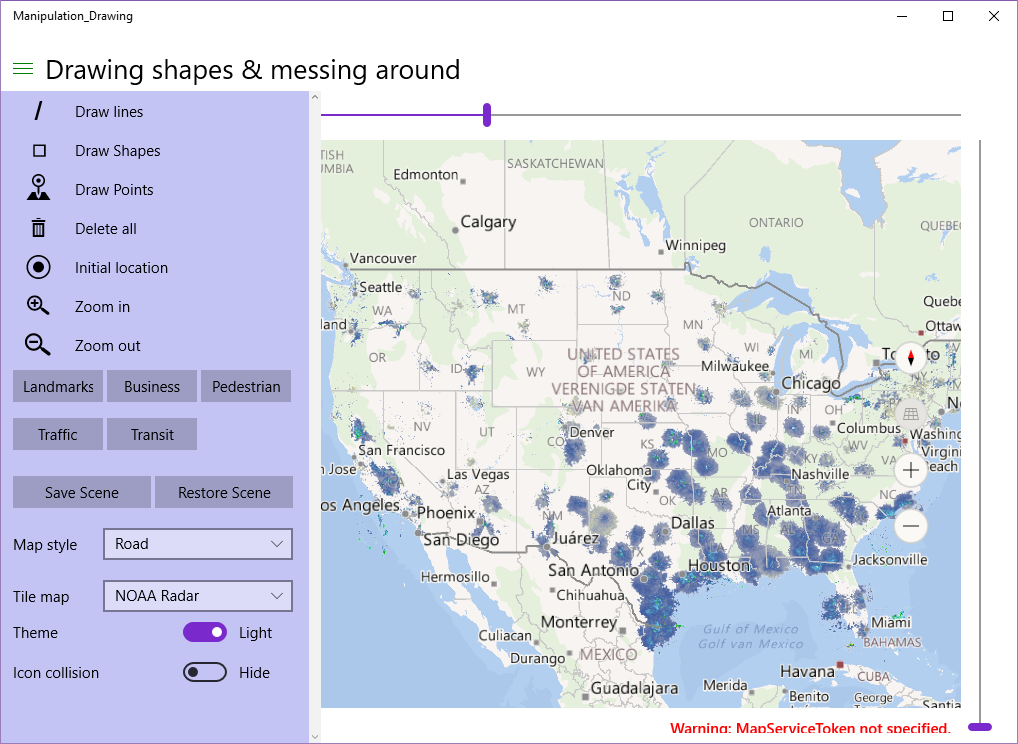
Set style back to "Roads", and zoom out more or less the USA, the select NOAA Radar. This shows the rain radar of the USA, as observed by the NOAA
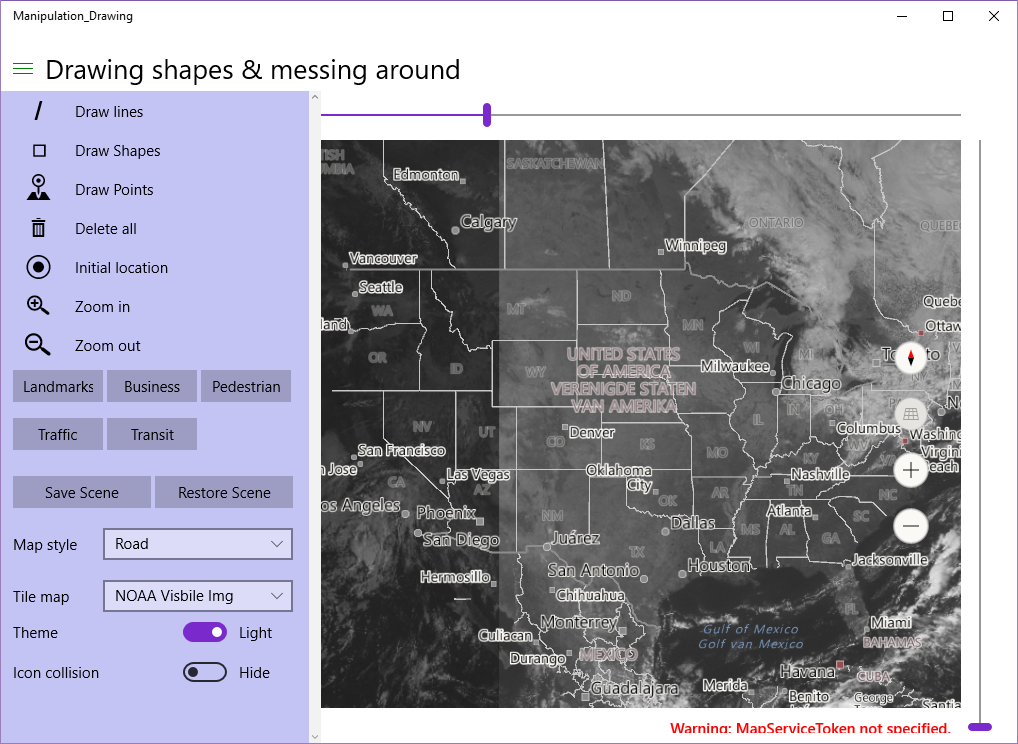
Looks like my friend Richard Hay is in for some rain over in Jacksonville. Or maybe it is just past him ;). Anyhow, if you select "Visible Img" you will get some real-time (or as near as real time as possible) weather satellite imagery in the visible light.
Now this is what I call a cloud service ;)
Now believe it or not, but all those beautiful maps are created by these simple methods way down in MainPage.Xaml.cs
And, of course, 'the supporting act' of some classes I wrote myself.
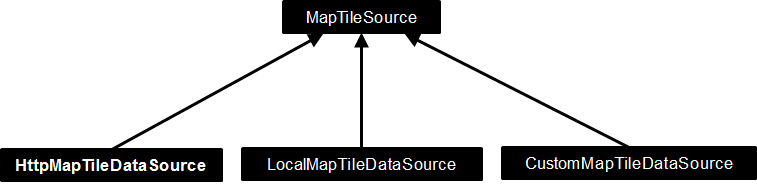
Tile sources Welcome to the wonderful world of tile maps. Our friends of the Maps develop team have created a small class hierarchy to serve up tile maps to a Windows app map. Add any child of MapTileSource to your map's TileSource collection and you have created a new map. It's as simple as that. There are three kinds of map tiles sources, as depicted in the diagram below:
HttpMapTileDataSource is meant to serve up map tiles via an URI to the web and download them on the fly
LocalMapTileDataSource is meant to serve up map tiles via an URI to titles that are downloaded to local storage
CustomMapTileDataSource is meant to cover all other cases - it does not ask for a remote or a local URI to a map tile, but asks you to return a 256x256 bitmap and it's up to you to determine where it comes from or how it's created.
My samples use HttpMapTileDataSource only, but of course the other classes are very interesting too, specifically LocalMapTileDataSource, as it opens the possibility to download and use tiles from any map to your device and use it from there, thereby creating your own Here-Maps-like offline experience.
HttpMapTileDataSource has a UriRequested event. You will need to attach a listener to it with this signature:
MapTileUriRequestedEventArgs has a Request property with four parameters:
Request
X
Y
Zoomlevel
The last three are input, based upon which the event listener must calculate a Uri, which needs to be put in Request - the output property. How this works in practice can be seen in for instance the OpenStreetMapSource:
Where do you get this wisdom? You can be a GIS expert, or just look for these kinds of tricks on the internet, and mostly they can be found on the tile provider's site itself. Sufficient to say OpenStreetMaps has 3 servers, and then the X, Y and Zoomlevel are simply in the path and the filename.
The MapTileDataSource and it's children sport a weird oddity, though. The most logical approach would be to subclass HttpMapTileDataSource, right? This is possible, as they are not sealed. All is well, up until the moment you actually try to use such a child class in real life by adding it to the map TileSources collection and have the map display itself. Then you are greeted by An exception of type 'System.Runtime.InteropServices.InvalidComObjectException' occurred in Manipulation_Drawing.exe but was not handled in user code WinRT information: The text associated with this error code could not be found.
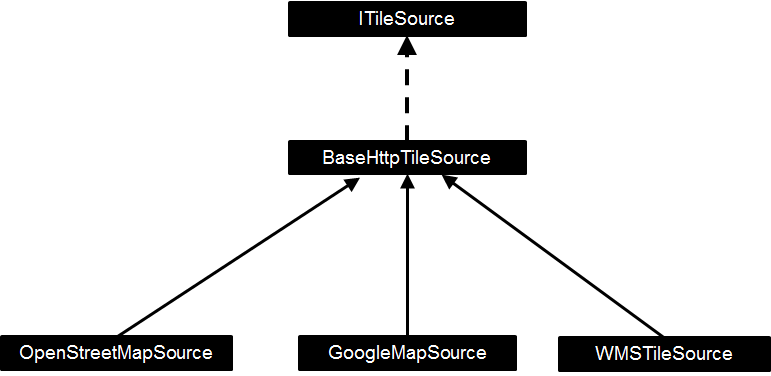
And good luck to you. Fortunately, where's a need, there's a workaround. I made a class containing a HttpMapTileDataSource, implementing an interface exposing that HttpMapTileDataSource. Meet BaseHttpTIleSource and it's friends.
ITileSource is pretty simple, as I alluded to:
It basically allows you to add YourTileSource.TileSource to the map's TileSource's collection without having aforesaid crash. BaseHttpTileSource is pretty simple, too.
public abstract class BaseHttpTileSource : ITileSource
{
  protected BaseHttpTileSource()
  {
    var t = new HttpMapTileDataSource();
    t.UriRequested += MapUriRequested;
    TileSource = t;
  }

  public MapTileDataSource TileSource { get; private set; }

  protected abstract void MapUriRequested(HttpMapTileDataSource sender,
    MapTileUriRequestedEventArgs args);
}
It takes away most of the plumbing of using a HttpMapTileDataSource and the only thing you need to do is subclass this and override the MapUriRequested method. As shown for OpenStreetMaps, and there is also such an override for Google:
protected override void MapUriRequested(HttpMapTileDataSource sender, MapTileUriRequestedEventArgs args)
{
  var deferral = args.Request.GetDeferral();
  args.Request.Uri =
    new Uri($"http://mt{(args.X%2)+(2*(args.Y%2))}.google.com/vt/lyrs={mapPrefix}&z={args.ZoomLevel}&x={args.X}&y={args.Y}");
  deferral.Complete();
}
WMS maps Web Map Services is a prime example of the age-old wisdom stating a camel is a horse designed by a committee - the committee in this case being the Open Geo Consortium. OGC is - or at least was in that time - a group op GIS professionals of academic origin and they have clearly tried to a design a protocol that catered for a wide variety of analytic needs - of course using XML, which was the hot rage in the days it was designed. What they did not do was taking into account banal things like consistency, ease of use, performance, and other things that are valued by mere mortals who just want to have a bloody map in their web page or app. And if you think this is bad, try to read the specifications for vector data (WFS or Web Feature Service), a format so convoluted, bloated, with so much versions, inconsistencies and complexities that it almost requires a PhD to get a basic understanding of how it works - let alone use it. WMS servers used to be slow, bandwidth and processing power gorging monsters. And this in the early 2000s, the year where most web access was served over 56k6 dial up lines, and a top of the line computer had a Pentium 4 processor. No wonder it never gained much use outside of the specialist realm.
But I digress. I wrote a small class that will serve as a WMS client for the limited scenarios that play nice with the Windows map control, which require little knowledge of the actual plumbing for using it. This class is called WmsTileSource, How it's used, you can see in InitTileComboBox, where I initialize four instances of it. To explain how you get to such parameters, I will need to explain a bit first. The next paragraph is me getting on my GIS hobby horse. If you do not care about that, at least read the two bullet points halfway and the first sentence of the paragraph below the Africa picture.
Projections (and coordinate systems)
This may come as a surprise, but the Earth is not flat, yet every map since the beginning of map making pretends it is. This has various, mostly historical reasons, the most notable being the fact it's much easier to roll up a flat map of the of Earth's pieces you are interested in (or put a lot of them in a book) and take those along for the trip, than to lug around a true representation of the Earth - which most likely would contain a lot of details on stuff you don't need, and too little of the stuff you do. Yes kids, people used to lug atlases around, books with maps. They have the added bonus of never running out of battery.
So a map needs (or needed) to be flat, which makes it necessary to put the outside of what is essentially a sphere on a flat surface. That cannot be done without some dire consequences. Peel an orange and try to make the outside a continuous flat surface - and you will understand what I mean.
This is where projections come into play. These are ways to fit the sphere's outside on a flat surface. There are literally thousands of projections in use, both for the whole planet and for parts of it - so much they are mostly designated by numbers - so called EPSG numbers - not by name. To the left I show only a few ways to project Earth. The most well-known version is the Mercator projection, shown top-left. It is also known as WGS84 or EPSG:4326 (that is the number I meant). There is also a variant of this, hated by professional cartographers everywhere, but it became instantly and overnight the most used projection worldwide as it is used by Google Maps. It is referred to as 'popular Mercator', initially had the tongue-in-cheek designation EPSG:900913 (900913 being 'Google in "leet speak"), later officially adopted as EPSG:3857.
The point of this whole rambling paragraph is two-fold:
The Windows 10 Maps control uses the EPSG:3857 projection. This means that only WMS servers that support delivering maps in EPSG:3857 / EPSG:900913 will correctly show data (that is, roads and stuff will appear on exactly the same places as your standard Here Maps data). EPSG:4326 will give 'mostly correct' results, provided you don't zoom out too much. All other projection systems won't work at all. At best they will show stuff in the wrong place, most likely it will appear to be wildly distorted as well.
The Popular Mercator projection comes with some severe consequences. One of them is that the further you go from the equator (move closer to the poles), the more stuff gets stretched. A whole generation now has grown up believing Greenland is about the size of Canada (the biggest country in the world bar Russia), and the northern American continent is about the size of Africa. Well, have a look at this map - and have a reality check, too. Cheers!
One minor detail: another thing Google made us do was using the WGS84 coordinate system (aka "lat/lon", standing for latitude and longitude) for a projection is was not intended to, because that is so convenient when using it in conjunction with satellite navigation. There are also a lot of ways to designate locations on Earth other than just latitude and longitude, but outside the GIS inner circle hardly anybody knows - and even less people care. There is a lesson to be learned: if you design too academically oriented standards, they will be wiped out or at least bastardized by market parties more interested in practical appliances than scientific correct approaches.
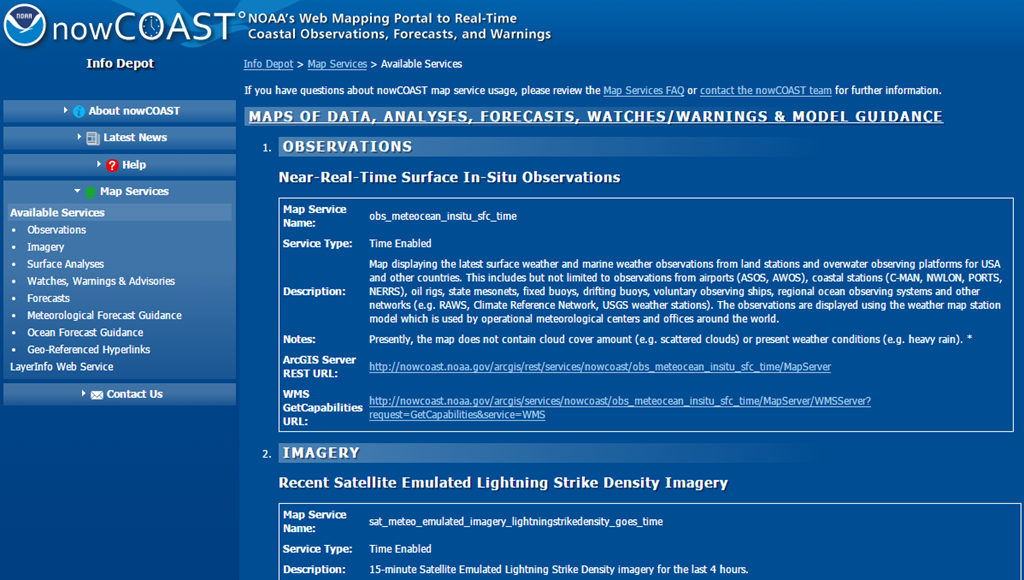
Finding the right parameters for the WmsTileSource Enough theory (and rambling) - we will now get down to business and actually use the WmsTileSource. First, you will need to know where the WMS server you want to use is actually located. This can be quite a challenge, but some institutions are really helpful. If you enter "noaa wms server" in Bing or Google and search a little around you will quite readily get to this site that shows you a whole range of interesting servers.
The important thing to know is that a WMS server can provide you with metadata about what it can and cannot do. These are called "capabilities" and you can get them but getting adding "?service=WMS&request=getcapabilities to the WMS URL. NOAA already has provided those links in their page - how thoughtful of them. You can click those links best using *cough*Google Chrome*cough* as that readily displays XML rather than trying to download it. So I clicked the third link (for "Recent GOES Weather Satellite Imagery", not visible in the image above) and then you get a rather depressingly long and hard to read XML potpourri. But don't despair, I will learn you a few tricks to quickly distill the things you need. We will need to find out:
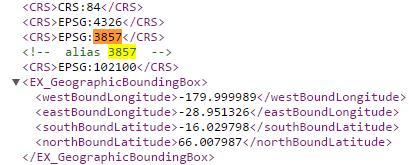
Does this thing support ESPG:3857, EPSG:900913 or EPSG:4326?
What coordinate system tag is it using?
What layers are available?
What version of WMS is it running?
Find the EPSG This one is easy. Just search for the number 3857, if you don't find that try 900913, then 4326. If you don't find anything, you're out of luck and the server is unusable. But good old NOAA does not fail us So yes, we can use this server, it supports even the most optimal projection (and 4326 as well, but why use good if you can get perfect).
Find the coordinate tag
Over time the WMS standard has 'evolved'. In ye olden days the coordinate system was designated using the SRS tag, now it's mostly using the CRS tag. I think - but I am not sure - in WMS version 1.1.1 it was SRS, in 1.3.0 it's CRS. Anyway - you can quite easily find this by first searching for CRS, and if you cannot find that, SRS. See the image above - this one is clearly using CRS.
Find available layers
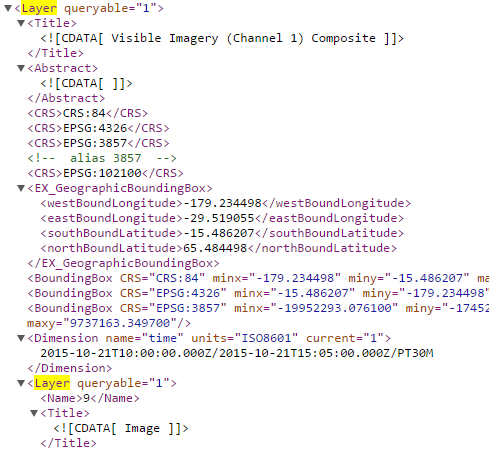
Guess what - you search for the text "Layer". Inside that Layer you will find a Title describing what it is and a Name that you will need to refer to it. NOAA have made this a bit complicated, but the important thing is to hunt for the Layer/Name.
So for Visible Imagery you will need a layer with the name "9". Usually a more descriptive name is used, but whatever.
Find the WMS version
Sometimes you can get this out of the URL, but if you cannot - well, you guessed it. Find the word "version" and that will give you give you most likely two possible outcomes: 1.3.0 or 1.1.1
Putting it all together So know we have:
EPSG = 3857
Coordinate system tag = "CRS"
Layer = "9"
WMS version is "1.3.0"
This will allow us to construct a WMS layer like this:
Notice that the layers are actually constructed as an array, as you can request for multiple layers on top of each other. This only makes sense when the layers are partially transparent, and visible imagery is not - so in this case it doesn't make sense. But if you want to use radar rain images on top of cloud data (see code inside InitTileComboBox) that makes perfect sense. Be aware that layers a drawn in order of appearance, so the last layer in the array will appear on top.
Also notice I did not provide any data for the EPSG. That is because that's the last parameter, and it's default value is 3857.
One more thing In all cases - be it WMS to TMS - the device you are using goes out to the web to get tiles. That is why a HttpMapTileDataSource has an "AllowCaching" property, that is default set to true. So even if you don't download map tiles to your device, it still caches them - a nice feature for both your users and the map providers.
Conclusion I have shown you the amazing versatility of the Windows Maps control in nearly all aspects in this series, and hope to have inspired you to look beyond the data that is offered by default with this last post. The world of geo data is a fascinating one, it is a shame so much is locked up behind the complexities of confusing, convoluted and/or outdated protocols.
Enjoy mapping! And let me know if you have found a cool map server to use in your app.
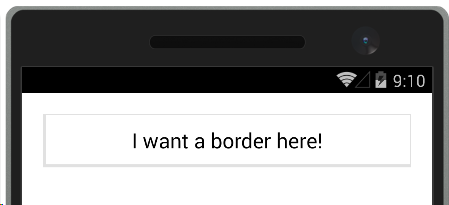
This is one of those blog posts, born out of utter frustration because looking for this yielded no usable results - while you would expect a lot of people would be wanting to do, as it's quite elementary IMHO. Maybe it's just my inexperience with Xamarin Forms, but for the life of me I could not find how to place borders around panel-like structures like a grid. Sure, there is Frame, but that places a meager 1 pixel hardly visible line around it.
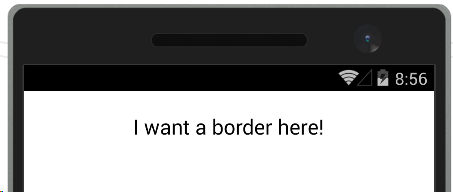
Result in in the UI below (on the Visual Studio Android Emulator)
How on Earth do you get something like this?
Turns out you need a couple of ContentViews inside each other like a bunch of Matryoshka dolls - one with the border color as background color, and inside that a slightly smaller ContentView with the same background color as the page. Like this:
So we have the internal view that has the same background color as the page, as well as a padding of 10 on every side to make the border not too tight around the text. Then the 'border contentview' around that has a padding 0 3,1,1,3 so that it's slightly larger bottom and right as to create some kind of shadow effect. If you don't want that, just make the padding equal. I defined the settings a styles as to make them easily reusable (they are in a app-wide resource dictionary in the app I am now developing).
Why it has to be this way - no idea, but I hope it will save some other Xamarin Forms newbie the frustration I experienced this afternoon. Maybe there are better alternatives - I really welcome comments. But this works
Intro Picking up the thread where I left it rushing into an IoT series, which I wanted to have ready before the Microsoft devices event that took place on October 6th, I will now write bit about scenes and camera. These are features that are part are designed to work with the new 3D view, that already made an appearance in the previous part of this series.
The problem Maps in were always 2D previously. You can play with the pitch and show landmarks on it, and that gets a bit of a 3D effect, but the map itself is still flat, and the view on your map is orthogonal (that is, straight from above), like you are holding a paper map. Only the zoom level (i.e. the distance from your eye to the map) and the point directly below you (the map center) determined what you look at. This approach no longer works when you use a 3D map like Windows 10 features. Now, you are basically floating in space next to a sphere (Earth, to be specific) and you can look in any direction you want - directly below the point you are floating next to (or above, whatever) but you can also look sideways, to the 'top' of the sphere, or even from it. You can rotate so South is up. So although the point directly below you and the distance between ('height') are still a factor in what you can see, they are no longer the only factor.
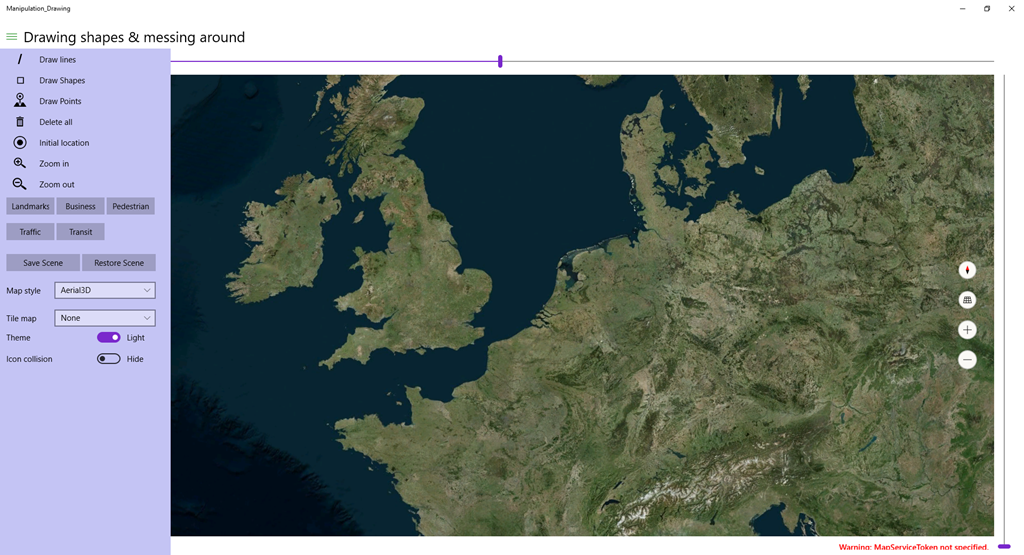
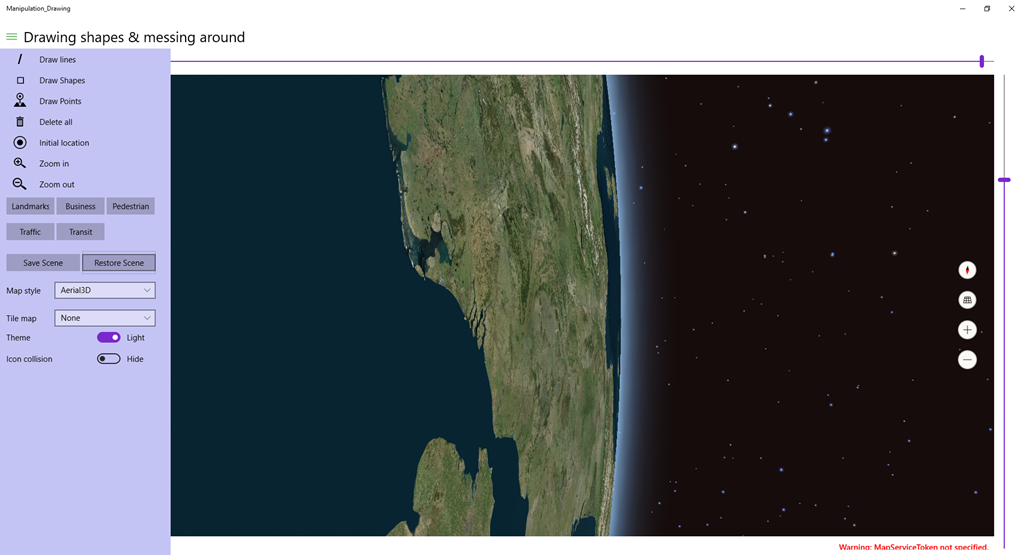
To illustrate what I mean, I can best show a few pictures. First, here we have Earth, and we are floating directly over the Netherlands. Basically, there's not much different from a normal orthogonal map, although this shows a bit of the curve of the Earth
Now let's play a little with the controls:
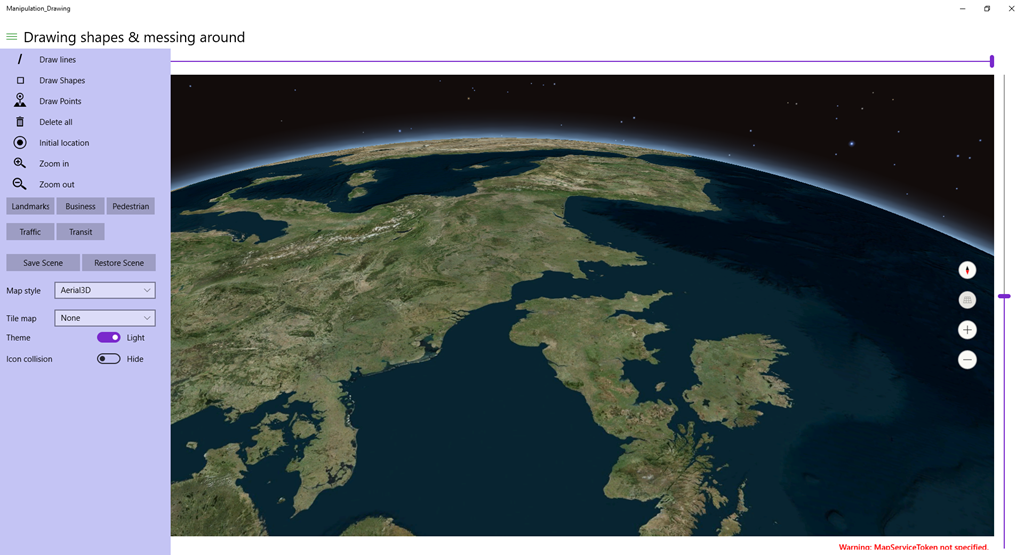
First I changed the pitch using the canvas (the controls on the right of the map, the 2nd one from above)
Then I rotated about 180 degrees using the top canvas control
You get a totally different view now!
Space, the final frontier ;) .
The solution We need a new helper class, something that helps us create a view given a number of parameters. And luckily, Microsoft have provided not one but actually two: MapCamera and MapScene.
My demo solution actually does very little with both: the save scene button saves the current way you are looking at the map (Earth), and Restore brings you back to it.
MyMap.TrySetSceneAsync is actually async so it could be awaited, but since this is a simple fire-and-forget method I can't be bothered with that.
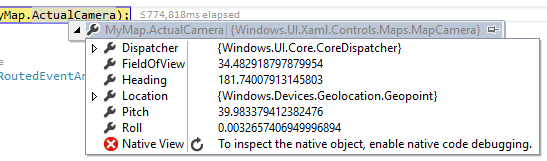
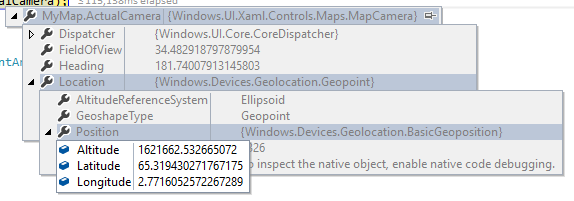
If we put a breakpoint in SaveScene we can see the MapCamera's values
And it's location
So apparently I am looking almost due South (Heading 181), from a location that about 1600km above a point that is a bit west and a whole lot more north than the Netherlands (latitude and longitude for the center of our tiny spec by the sea is about 52, 5), pitched upward almost 40°, and rolled a wee bit to the right. My app does not support setting all camera features, but you if you set a breakpoint on SaveScene and change the roll value to 90 before you let it continue, you will get this effect on hitting restore - and you can imagine looking out of a forward-looking window of your spaceship in orbit - that is presumably in some pretty unlikely polar orbit considering the direction it's travelling into
The properties of the MapCamera are all excellently explained here in the official documentation and there's also a very good picture illustrating what I mean with 'floating next to a sphere and lookup down on it'
Now Microsoft have recognized the fact that not everyone is a spatial expert and that it may indeed be very hard to create a view in a 3D map that shows all what you want using just the camera, especially when there are blocking features. That's where the MapScene class comes into place. As you may already have noticed, the Map's Camera itself is read only, you can only use the camera to create a Scene from, then put it back to a map.
The intent though is that you create a Scene using one of the static methods the class provides. There is a method to create a camera from a bounding box, optionally specifying a heading an a pitch, a method to create one from a location and a radius, but the best I like is the one that makes sure any number of points in a list will show up. This is a great feature to show all your initial points in your 3D map app - for instance, all flying airplanes in 3D within the target area of your map.
Conclusion Lots of talk this time, little code. MapCamera and (especially) MapScene make programmatically navigating around a map a lot easier, but it still take some experimenting to check if you get desired results. For me, having grown up in a world of 2D maps and having worked in 2D GIS for 20+ years, it's just as hard as you ;)
Part 6 of Reading temperatures & controlling a fan with a RP2, Azure Service Bus and a Microsoft Band
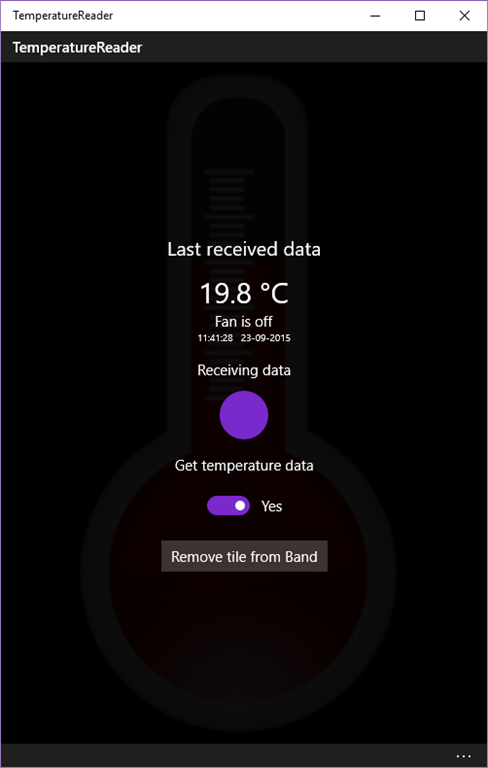
Intro In the final post of this series I will show how the Microsoft Band client in this project, that is used to actually read temperatures and control the fan, is created and operated. The client has a tile and a two-page UI, looks like this and can be seen in action in this video from the first blog post:
To recap - the function of the Band client is as follows
WhenI tap the tile on the Band, the UI is opened and shows the latest data, that is:
The temperature as last measure by the Raspberry PI2
A button I can use to toggle the fan. The text on the button reflects the current status of the fan (i.e. it shows "Stop fan" when it's running, and "Start fan" when it is not
Date and time of the last received data.
The classes involved As you can see in the demo solution, there are three classes, and one interface, all living in the TemperatureReader.ClientApp's Models namespace - that have something to do with the Band:
BandOperator
BandUiController
BandUiDefinitions
IBandOperator
I showed a little bit of it in the previous post that described the Windows 10 UWP app itself, but to recap: the app is put together using dependency injection, so every class gets everything (well, almost everything) it needs passed via the constructor, and only knows what it gets via an interface (not a concrete class). In addition, most communication goes via events.
Start it up If you look in the MainViewModel's CreateInstance method, you will see the BandOperator first spring into life:
public static MainViewModel CreateNew()
{
  var fanStatusPoster = new FanSwitchQueueClient(QueueMode.Send);
  fanStatusPoster.Start();
  var listener = new TemperatureListener();
  var errorLogger = SimpleIoc.Default.GetInstance<IErrorLogger>();
  var messageDisplayer = SimpleIoc.Default.GetInstance<IMessageDisplayer>();
  var bandOperator = new BandOperator(fanStatusPoster);
  return (new MainViewModel(
    listener, bandOperator,
    messageDisplayer, errorLogger));
}
I grayed out the stuff that is not so important here, but you see the BandOperator uses the FanSwitchQueueClient (see explanation in this post) to defer sending data on Azure Service bus to, and then it's passed to the MainViewModel. Apparently some other mechanism is used to deliver temperature data from the Azure Service bus, and that code is found in the Start method of MainViewModel:
You can see the listener - being a ITemperatureListener, see also this post - simply passes the event to the BandOperator, starts it, and makes the Band vibrate. So you see - the actual code that operates the Band is very loosely coupled to the rest of the app. But what you also see - the Band does not listen to the data coming form the Azure Service Bus, nor does it send data. That app does that interaction, and the Band - in turn - interacts with the app.
Some definitions first What is important to understand is that the UI lives on the Band, an remains there. Changing it, and responding to events, is essentially a process that runs on your phone, not on the Band, and you are interacting with a process that sends data over Bluetooth - but that is mostly abstracted away. Building a Band UI is also vastly different from what you are used to, using XAML. You are basically writing code to build the structure of the UI, then fill it with data using even more code. There is no such things as data binding. All UI elements have to be defined using unique identifiers - no such things as easily recognizable names. It harkens back to ye olden days from even before Visual Basic.
Anyway, there is this separate definition class that contains all the necessary ids:
using System;

namespace TemperatureReader.ClientApp.Models
{
  public static class BandUiDefinitions
  {
    public static readonly Guid TileId =
      new Guid("567FF10C-E373-4AEC-85B4-EF30EE294174");
    public static readonly Guid Page1Id =
      new Guid("7E494E17-B498-4610-A6A6-3D0C3AF20226");
    public static readonly Guid Page2Id =
      new Guid("BB4EB700-A57B-4B8E-983B-72974A98D19E");

    public const short IconId = 1;
    public const short ButtonToggleFanId = 2;
    public const short TextTemperatureId = 3;
    public const short TextTimeId = 4;
    public const short TextDateId = 5;
  }
}
So we have three main UI ids - the tile, and both 'pages', that need to have a GUID. I just generated a few using Visual Studio, what GUID you use does not really matter - they need to be different from each other and refrain from re-using them - even over projects. Then there's five user interface elements.
On the first page - the one you see when you tap the tile: the thermometer icon, the button to turn the fan on or off (also used to show the current fan status), and the label that shows the temperature as measured by the Raspberry PI2
On the second page two label fields, that show the time and the date of the last received update from the Azure Service Bus as received by the App.
The UI looks like this:
The tile that you can tap
The first page, with icon, temperature reading and button. The button now says "Start fan", so apparently the app has already received date from the Raspberry PI2, and it indicated the fan is off. Notice a little part of the second page is already visible on the right, alerting the user there's more to be seen and encouraging him to scroll to the right - a UI pattern in use since the very early days of Windows Phone 7.
The second page (with date and time of last received data)
The user interface element ids are just just integers, but I make them globally unique - that is, unique in the app. The fact that they are spread over two 'pages' comes from the fact that the Band has a very small display, and you will need to make use of it's multi-page features if you want to show anything but the most trivial data. Fortunately, once you understand how it works, that is not very hard to do.
Building the Band client UI I have separated the actual operating building and manipulating of the Band UI from the 'business logic' concerning the interaction with events coming from the Azure Service Bus. So we have the BandUiController and the BandOperator. A crude and not completely correct analogy could define the BandUIController as the view, and the BandOperator as a kind-of-viewmodel. I did this because at one point I had a class approaching 300 lines and things got very confusing. So I split it up. I show only a little excerpt of the BanOperator before I start explaining the BandUIController first.
The BandUIController needs access to a IBandClient to be able to work on the Band's UI. You need to retrieve one first. How this works, you can see in the BandOperator's GetNewBandClient method:
var pairedBands = await BandClientManager.Instance.GetBandsAsync();
if (pairedBands != null && pairedBands.Any())
{
  return await BandClientManager.Instance.ConnectAsync(pairedBands.First());
}
And this IBandClient is injected into the BandUIController via the constructor. We have seen this pattern before in this series
public class BandUiController
{
  private readonly IBandClient _bandClient;

  public BandUiController(IBandClient bandClient)
  {
    _bandClient = bandClient;
  }
}
The next important thing to understand is that although both occur from code, defining the Band interface and actually displaying stuff in it are two separate actions. The public interface of the BandUIController actually only has four methods - and one of them is an overload of another:
public async Task<bool> BuildTile();
public async Task RemoveTile();
public async Task SetUiValues(string timeText, string dateText,
                              string temperature, string buttonText);
public async Task SetUiValues(string temperature, string buttonText);
The first one builds the tile (and the rest of the UI), the second one removes it. The third one sets all the UI elements' value, the second one only that of the elements on the first page - that is used for when you press the button to switch the fan on or off. So let's have a look at BuildTile first.
public async Task<bool> BuildTile()
{
  if (_bandClient != null)
  {
    var cap = await _bandClient.TileManager.GetRemainingTileCapacityAsync();
    if (cap > 0)
    {
      var tile = new BandTile(BandUiDefinitions.TileId)
      {
        Name = "Temperature reader",
        TileIcon = await LoadIcon("ms-appx:///Assets/TileIconLarge.png"),
        SmallIcon = await LoadIcon("ms-appx:///Assets/TileIconSmall.png"),
      };

      foreach (var page in BuildTileUi())
      {
        tile.PageLayouts.Add(page);
      }
      await _bandClient.TileManager.AddTileAsync(tile);
      await _bandClient.TileManager.RemovePagesAsync(BandUiDefinitions.TileId);
      await _bandClient.TileManager.SetPagesAsync(BandUiDefinitions.TileId,
        BuildIntialTileData());
      return true;
    }
  }
  return false;
}
First thing you need to do is check remaining tile space capability. There's only room for up to 13 custom tiles, so chances are there's not enough room. If there is no space, this client silently fails. But if there's room, the tile is created with the designated GUID, a big and a small icon. The big icon appears on the tile, the small icon is typically used on notifications, but both can be used otherwise (as we will see later). "Large" is maybe stretching it a little as it's only 46x46 (the small one is 24x24). "LoadIcon" is a little routine that loads the icon and I nicked those from the Band samples. Then the tile UI pages are being built using BuildTileUi, and are added to the tile's PageLayout collection. So far, so good. Then things get a little murky.
First we add the tile - with page definitions - to the Band UI. By default, it is added to the very right side of the tile strip - just before the settings gear tile.
Then we remove any possible data possibly associated with the pages using RemovePagesAsync. Remember, this is not the structure, just what is being displayed on it.I am not 100% sure this line of code is actually needed, but I just left it while experimenting
Then we are adding the default data to display on the tile pages' UI elements using SetPagesAsync
Let's first have a look at BuildTileUi
private IEnumerable<PageLayout> BuildTileUi()
{
  var bandUi = new List<PageLayout>();

  var page1Elements = new List<PageElement>
  {
    new Icon {ElementId = BandUiDefinitions.IconId,
      Rect = new PageRect(60,10,24,24)},

    new TextBlock  {ElementId = BandUiDefinitions.TextTemperatureId,
      Rect = new PageRect(90, 10, 50, 40)},
    new TextButton {ElementId = BandUiDefinitions.ButtonToggleFanId,
      Rect = new PageRect(10, 50, 220, 40),
      HorizontalAlignment = HorizontalAlignment.Center}
  };

  var firstPanel = new FilledPanel(page1Elements) {
    Rect = new PageRect(0, 0, 240, 150) };

  var page2Elements = new List<PageElement>
  {
    new TextBlock {ElementId = BandUiDefinitions.TextTimeId,
      Rect = new PageRect(10, 10, 220, 40)},
    new TextBlock {ElementId = BandUiDefinitions.TextDateId,
      Rect = new PageRect(10, 58, 220, 40)}
  };

  var secondPanel = new FilledPanel(page2Elements) {
    Rect = new PageRect(0, 0, 240, 150) };

  bandUi.Add(new PageLayout(firstPanel));
  bandUi.Add(new PageLayout(secondPanel));

  return bandUi;
}
Now this may look a bit intimidating, but it's actually not so hard to read.
First we create the UI elements of the firstpage - an Icon, a TextBlock, and a TextButton, all with location and size defined by a PageRect, relative to the panel they are going to be in.
Then we create the first panel, add the list of the UI elements created in the previous step on it, then define it's size and location by a PageRect as well. I am not exactly sure what the maximum values are for a panel, but 240, 150 works out nice and leaves enough space to the right to make the next page visible
Then we create the UI elements of the second panel - two TextBlocks of identical size, the second one right under the first
Then we create a second panel with the same size as the first panel
Finally, we create a PageLayout from both panels and add those to the list.
As we could see in the BuildTile method the result of the BuildTileUi method is added the tile's PageLayouts collection:
foreach (var page in BuildTileUi())
{
  tile.PageLayouts.Add(page);
}
At this point, we have only defined the structure of what is to be displayed on the Band. It still does not display any data.
Showing data on a Band UI Let's have a look at BuildTile again. It's using this line of code to display data
BuildIntialTileData. that just shows some default strings, in turn calls this method
private List<PageData> BuildTileData(string timeText, string dateText,
                                     string temperature, string buttonText)
{
  var result = new List<PageData>
  {
    BuildTileDataPage2(timeText, dateText),
    BuildTileDataPage1(temperature, buttonText)
  };
  return result;
}
And then we come to the heart of the matter (as far as displaying data is concerned) - that is, these two little methods:
private PageData BuildTileDataPage1(string temperature, string buttonText)
{
  return
    new PageData(
      BandUiDefinitions.Page1Id, 0,
      new IconData(BandUiDefinitions.IconId, 1),
      new TextButtonData(BandUiDefinitions.ButtonToggleFanId, buttonText),
      new TextBlockData(BandUiDefinitions.TextTemperatureId, $": {temperature}"));
}

private PageData BuildTileDataPage2(string timeText, string dateText)
{
  return
    new PageData(BandUiDefinitions.Page2Id, 1,
      new TextBlockData(BandUiDefinitions.TextTimeId, $"Time: {timeText}"),
      new TextBlockData(BandUiDefinitions.TextDateId, $"Date: {dateText}"));
}
Let's first dissect BuildTileDataPage2 as that is the most simple to understand. This says, basically: for page with Page2Id, which is the 2nd page on this UI (the page numbering is zero based) set a text on a TextBlock with id BandUiDefinitions.TextTimeId, and set another text for BandUiDefinitions.TextDateId. The third parameter of the PageData constructor is of type params PageElementData[] so you can just go on adding user interface value settings to that constructor without the need of defining a list.
In BuildTileDataPage1 we do something similar - bar that the page index now is 0 in stead of 1, a text on a TextButton needs to be of TextButtonData in stead of TextBlockData. and the first item is an IconData. Notice that it adds an icon with index 1. That is the small icon. Remember this piece of code in BuildTile?
var tile = new BandTile(BandUiDefinitions.TileId)
{
  Name = "Temperature reader",
  TileIcon = await LoadIcon("ms-appx:///Assets/TileIconLarge.png"),
  SmallIcon = await LoadIcon("ms-appx:///Assets/TileIconSmall.png")
};
That was added as second, but of course that's zero based as well. You can also add additional icons to the UI but that's not covered here.
Now there is one important final piece of information that you may not have noticed. In BuildTileData I first add the second pagedata to the list, and then the first. I found it necessary to do it that way, or else the UI appears in reverse order (that is, the page with the date/time is displayed initially, and you have to scroll sideways for the page with the button and the temperature. Sometimes, just sometimes it happens the wrong way around anyway. I have not been able to determine what causes this, but if you add the pagedata in reverse order, it works most times - like in, I saw it go wrong two or three times, and only during heavy development.
The public methods to change the UI values are very simple wrappers around code we have already seen:
The first one refreshes the whole UI, the second only the first page. So that is what is necessary to create a UI and display some data on it. Four UI elements, two pages. Really makes you appreciate XAML, doesn't it? ;)
Handling Band interaction The BandOperator bascially only has the following functions:
When a tile is pressed, show the Band UI with the most recent data received from the Azure Service bus
When the toggle button is pressed fire off a command on the Azure Service bus
When the fan status change is confirmed by the Raspberry PI2, toggle the text on the button
... and yet, it's almost 250 lines long. A lot of that has to do with problems I encountered when a suspended app was resuming. I have tried to fix that using quite an elaborate method to get and create a Band client (the GetBandClient method) - that and it's helper methods are 60 lines in itself. So I will skip over that, but have a look at it in the demo solution to see how I tried to solve this. I am still not quite satisfied with it, but it seems to work. Most of the times.
Moving to the BandOperator's Start method, you can see how the interaction is set up
public async Task<bool> Start(bool forceFreshClient = false)
{
  var tilePresent = false;
  var bandClient = await GetBandClient(forceFreshClient);
  if (bandClient != null)
  {
    var currentTiles = await bandClient.TileManager.GetTilesAsync();
    var temperatureTile = currentTiles.FirstOrDefault(
      p => p.TileId == BandUiDefinitions.TileId);
    if (temperatureTile == null)
    {
      var buc = new BandUiController(bandClient);
      tilePresent = await buc.BuildTile();
    }
    else
    {
      tilePresent = true;
    }

    if (tilePresent)
    {
      await bandClient.TileManager.StartReadingsAsync();
      bandClient.TileManager.TileOpened += TileManager_TileOpened;
      bandClient.TileManager.TileButtonPressed += TileManager_TileButtonPressed;
    }
  }
  IsRunning = tilePresent;
  return tilePresent;
}
Basically this methods tries to either find an existing tile, and failing that, create a BandUiController to make one. bandClient.TileManager.StartReadingsAsync then activates listening to Band events - and by attaching events to TileOpened and TileButtonPressed the handler methods will be called - if the tile on the Band UI button is pressed, or if a button on the custom UI of the tile is pressed.
private async void TileManager_TileOpened(object sender,
  BandTileEventArgs<IBandTileOpenedEvent> e)
{
  var bandClient = await GetBandClient();
  if (bandClient != null)
  {
    if (e.TileEvent.TileId == BandUiDefinitions.TileId && _lastTemperatureData != null)
    {
      var buc = new BandUiController(bandClient);
      await buc.SetUiValues(
        _lastTemperatureData.Timestamp.ToLocalTime().ToString("HH:mm:ss"),
        _lastTemperatureData.Timestamp.ToLocalTime().ToString("dd-MM-yyyy"),
         $"{_lastTemperatureData.Temperature}°C",
         GetFanStatusText());
      await bandClient.NotificationManager.VibrateAsync(
         VibrationType.NotificationOneTone);
    }
  }
}
So the funny thing is - this method gets called when a tile is pressed on the Band. Any tile, not necessarily the one just created. So first we have to determine if it was actually our tile that was being pressed, by checking the tile id against the id of our tile. When that is the case, we create a BandUIController and update the UI values with the last received data from the Azure Service bus. And then we send a single vibration, so the Band wearer knows new data was received immediately (without checking the date and time on the 2nd page of our custom UI).
A similar procedure goes for the handling of the fan button press:
private async void TileManager_TileButtonPressed(object sender,
   BandTileEventArgs<IBandTileButtonPressedEvent> e)
{
  var te = e.TileEvent;
  if (te.TileId == BandUiDefinitions.TileId &&
    te.PageId == BandUiDefinitions.Page1Id &&
    te.ElementId == BandUiDefinitions.ButtonToggleFanId)
  {
    if (!_isProcessing)
    {
      _lastToggleUse = DateTime.UtcNow;
      _isProcessing = true;
      var cmd = new FanSwitchCommand(_lastFanStatus, true);
      Debug.WriteLine($"Sending fan command {cmd.Status}");
      await UpdateFirstPageStatus();
      await _fanStatusPoster.PostData(cmd);
    }
  }
}
First, we need to check if the button was pressed on our custom layout - in theory, that would have been enough as there is only one button on it, but for good measure you can also check for the page and the element id in that page. What then basically happens is that text of the button is changed to "Processing" and a FanSwitchCommand is sent to the Raspberry PI2.
The changing of the text on the button is done via UpdateFirstPageStatus, that in turn uses GetFanStatusText
private async Task UpdateFirstPageStatus()
{
  var bandClient = await GetBandClient();
  if (bandClient != null)
  {
    var text = GetFanStatusText();
    var buc = new BandUiController(bandClient);
    await buc.SetUiValues($"{_lastTemperatureData.Temperature}°C", text);
  }
}

private string GetFanStatusText()
{
  return _isProcessing ? "Processing" :
    _lastTemperatureData.FanStatus == FanStatus.On ? "Stop fan" : "Start fan";
}
The logic behind this is as follows:_isProcessing used to prevent the user from pressing the toggle button multiple times in a row. When you press the button, one of the first things that happens is that _isProcessing is set to true, effectively barring you from doing something with the button again. The text on the button changes to "Processing". The BandOperator is now waiting for the Raspberry PI2 to confirm it has actually toggled the fan. But you cannot change the value of one UI element on a Band page - you have to refresh all of them. So I call the BandUiController's SetUiValues overload with both the new button text and the last received temperature.
So how is the loop closed? How does the BandOperator know the Raspberry PI2 has indeed toggled the fan? The answer lies in the HandleNewTemperature method that receives new temperature data from the rest of the app (remember that it was wired up in MainViewModel.Start?)
public async void HandleNewTemperature(object sender, TemperatureData data)
{
  Debug.WriteLine(
    $"New temperature data received {data.Temperature} fanstatus = {data.FanStatus}");
  _lastTemperatureData = data;
  _lastTemperatureData.Timestamp = DateTimeOffset.UtcNow;
  if (_lastFanStatus != _lastTemperatureData.FanStatus && _isProcessing)
  {
    _isProcessing = false;
    _lastFanStatus = _lastTemperatureData.FanStatus;
    await UpdateFirstPageStatus();
  }
  else if (_lastToggleUse.IsSecondsAgo(Settings.FanSwitchQueueTtl) && _isProcessing)
  {
    _isProcessing = false;
    _lastFanStatus = _lastTemperatureData.FanStatus;
    await UpdateFirstPageStatus();
  }
  else if (!_isProcessing)
  {
    _lastFanStatus = _lastTemperatureData.FanStatus;
  }
}
So, the received temperature data does not only contain temperature but also the current status of the fan. But if this method was to accept the fan status right away after we had sent off a command to toggle the fan, the button text would immediately flip back to the old text - because the command had not reached the Raspberry PI2 yet, and it would not have time to react and send a confirmation.
So what we do is - when new temperature data arrives, _isProcessing is true (so the user has recently clicked the toggle button) and the received data indicates a status flip - then the Raspberry PI2 has received the toggle command and has acted upon it. So the button is updated from "Processing" to a value according the new fan status. If there is no status change, but the last toggle button use was longer ago then the message time-to-live of the FanSwitchQueue - we assume the command has never reached the Raspberry PI2, we update the _lastFanStatus to the old status, and update the button accordingly. In any other cases, if the user has not pressed the button recently, we just keep the last fan status. This has not much to do with the Band or the UI itself - it's just dealing with possible delays from message delivery (and possible messages not being received by the other party).
Conclusion Making a custom Band UI is doable, but you do need to pay a lot of attention to detail to get things right. It's definitely more challenging than creating a UI using Blend, as you basically need to keep seeing the whole UI in your mind - there is no way of visually designing it or even make it visible short of running the app and checking the result on the Band. Debugging is a time and battery consuming activity. Acting upon events and having code interact with remote devices has some particular challenges too. And sometimes things just go wrong - but it is not always clear if those things were caused by me doing things wrong or not understanding the finer details of the Band UI API, the fact that I am using it on Windows 10 mobile (which is still in preview at this moment) or bugs in the various APIs (Band or otherwise) that I use to stitch things together. On the bleeding edge is where you suffer pain - but you have the most fun as well.
And yet, the potential use cases are pretty appealing and are giving a nice idea of how the (very near) future of device coding with Windows CoreIoT looks like. And it has practical appliances too. Recently I was on a holiday in Neustadt an der Weinstraße (where amongst others this blog post was written so the sample location was not entirely random :) ) I had this contraption running at home - but I had put in in my study at home and had connected it to a powerful spot light in stead of a fan. I had my Lumia 1520 and Band with me - and although being physically in Germany, I was able to turn on a light at home (and get confirmation it was actually on or off) by clicking a button on my Band. Thus hopefully convincing potential burglars the house's resident geek was at his computer and the house was occupied. Not that there's much worth stealing anyway, but it's not fun to get home and find broken windows and stuff. If it had any effect - I don't know, but our house was left alone during our absence.
Well, this marks the end of a rather epic and quite voluminous blog post series.I encourage you one final time to download and check the demo solution - and build kick *ss stuff yourself with CoreIoT and/or the Band. Even Doctor Who is into wearable technology these days, and so should we all be :D
Part 5 of Reading temperatures & controlling a fan with a RP2, Azure Service Bus and a Microsoft Band
Intro You cannot deploy apps to a Microsoft Band directly, so there is always a kind of app running on the device to which it is paired on which the code is actually running. Typically this is a phone, but there since this is a Universal Windows App, there is no reason why it could not run on a PC, like this screenshot shows :). Yet, I have found out that although you can pair a Band to a PC, it will insist on connecting to the app before showing a UI, so you cannot actually use it with a PC. So for the time being, you should use a phone.
This blog post will talk about the setup of the app itself, actually excluding most of the stuff related to the Band - and concentrate on how to setup a reasonably componentized app.
This app also uses dependency injection, as discussed in my post about the app on the Raspberry PI2, but this one makes full use of the MVVM pattern - to be more specific, MVVMLight, by my fellow MVP (although I can barely stand in his shade) Laurent Bugnion. I make use of his ViewModelBase and Messenger, as well as SimpleIoC for some inversion of control, and DispatcherHelper to get help me solve potential issues with background processes having effects on the UI.
Basic app setup The app starts (of course) in App.xaml.cs, of which I show a little excerpt:
The first two lines mean that whenever something requests something implementing an IMessageDisplayer, send him a Toaster. A similar thing goes for IErrorLogger. Retrieving something is a easy as using GetInstance - see App_UnhandledException. Toaster is a simple class to show a toast message, ErrorLogger is something I wrote for logging errors in local storage - for long running processes. Notice also the use of the Messenger in the App_Resuming. This is all part of making the viewmodel aware of things it needs to know, which ever making a direct dependency
If you use MVVMLight's DispatcherHelper, don't forget to initialize it (I always do for some reason, fortunately the error message is clear enough) and then I initialize my main viewmodel. Which, since this is a simple app, is the only viewmodel as well ;)
Bootstrapping the viewmodel The part of the viewmodel that handles startup and initializing is this:
using System;
using System.Globalization;
using System.Threading.Tasks;
using Windows.ApplicationModel.ExtendedExecution;
using Windows.Devices.Geolocation;
using GalaSoft.MvvmLight;
using GalaSoft.MvvmLight.Ioc;
using GalaSoft.MvvmLight.Messaging;
using GalaSoft.MvvmLight.Threading;
using TemperatureReader.ClientApp.Helpers;
using TemperatureReader.ClientApp.Messages;
using TemperatureReader.ClientApp.Models;
using TemperatureReader.ServiceBus;

namespace TemperatureReader.ClientApp.ViewModels
{
  public class MainViewModel : ViewModelBase
  {
    private readonly ITemperatureListener _listener;
    private readonly IBandOperator _bandOperator;
    private readonly IMessageDisplayer _messageDisplayer;
    private readonly IErrorLogger _errorLogger;

    public MainViewModel(ITemperatureListener listener,
      IBandOperator bandOperator,
      IMessageDisplayer messageDisplayer,
      IErrorLogger errorLogger)
    {
      _listener = listener;
      _bandOperator = bandOperator;
      _messageDisplayer = messageDisplayer;
      _errorLogger = errorLogger;
    }

    public void Init()
    {
      Messenger.Default.Register<ResumeMessage>(this,
        async msg => await OnResume());
    }

    // lots omitted

    private static MainViewModel _instance;

    public static MainViewModel Instance
    {
      get { return _instance ?? (_instance = CreateNew()); }
      set { _instance = value; }
    }

    public static MainViewModel CreateNew()
    {
      var fanStatusPoster = new FanSwitchQueueClient(QueueMode.Send);
      fanStatusPoster.Start();
      var listener = new TemperatureListener();
      var errorLogger = SimpleIoc.Default.GetInstance<IErrorLogger>();
      var messageDisplayer = SimpleIoc.Default.GetInstance<IMessageDisplayer>();
      var bandOperator = new BandOperator(fanStatusPoster);
      return (new MainViewModel(
        listener, bandOperator,
        messageDisplayer, errorLogger));
    }
  }
}
And here you see once again creation of a number of independent objects that will only be loosely connected. I could have gone further and let these also be created by having them registered in SimpleIoC, but the constructor will also allow me to 'inject' these objects into the viewmodel. Anyway, we see being created:
a FanSwitchQueueClient, that will transport the command to switch the fan on or off to the Raspberry PI2 via the Azure Service bus. It's details were explained in the 2nd post of this series. It's now in Send mode, as opposed to the app on the Raspberry PI2.
TemperatureListener listens to temperature data coming from the Raspberry PI2. It's a thin wrapper around TemperatureQueueClient (also explained in in the 2nd post of this series)
An ErrorLogger, which I will describe in a future blog post
A MessageDisplayer - it's implementation being something that shows a toast, as already mentioned
A BandOperator - a class that handles all interactions with the Microsoft Band as far as this app is concerned. This will be handled in detail in the next blog post. Notice it takes a FanSwitchQueueClient as a parameter - the BandOperator itself will handle the posting of the fan switch command (and defer the actual execution to the FanSwitchQueueClient).
For now, it's good enough to know the BandOperator has a very limited public interface, that looks like this:
TemperatureListener This is basically a very thin wrapper around the TemperatureQueueClient, that only adds 'remembering' the queue's status to the basic functionality:
public class TemperatureListener : ITemperatureListener
{
  private readonly TemperatureQueueClient _client;
  public TemperatureListener()
  {
    _client = new TemperatureQueueClient(QueueMode.Listen);
    _client.OnDataReceived += ProcessTemperatureData;
 }

  private void ProcessTemperatureData(object sender,
    TemperatureData temperatureData)
  {
    OnTemperatureDataReceived?.Invoke(this, temperatureData);
  }

  public async Task Start()
  {
    await _client.Start();
    IsRunning = true;
  }

  public bool IsRunning { get; private set; }

  public void Stop()
  {
    _client.Stop();
    IsRunning = false;
  }

  public event EventHandler<TemperatureData> OnTemperatureDataReceived;
}
Note that it puts the TemperatureQueueClient in Listen mode - this is again exactly the mirror image from what is happening on the Raspberry PI2
The view model's public interface - aka what is used for data binding These 5 properties - and the one method - are the only things that are available to the 'outside world' as far as the main view model is concerned:
public async Task RemoveTile()
{
  IsBusy = true;
  await Task.Delay(1);
  await _bandOperator.RemoveTile();
  IsBusy = false;
}

public bool IsListening
{
  get
  {
    return _listener?.IsRunning ?? false;
  }
  set
  {
    if (_listener != null)
    {
      if (value != _listener.IsRunning)
      {
        Toggle();
      }
    }
  }
}

private string _temperature = "--.-";
public string Temperature
{
  get { return _temperature; }
  set { Set(() => Temperature, ref _temperature, value); }
}

private string _lastDateTimeReceived = "--:--:--   ----------";
public string LastDateTimeReceived
{
  get { return _lastDateTimeReceived; }
  set { Set(() => LastDateTimeReceived, ref _lastDateTimeReceived, value); }
}

private string _fanStatus = "???";
public string FanStatus
{
  get { return _fanStatus; }
  set { Set(() => FanStatus, ref _fanStatus, value); }
}

private bool _isBusy;
public bool IsBusy
{
  get { return _isBusy; }
  set { Set(() => IsBusy, ref _isBusy, value); }
}
The method "RemoveTile" is called to remove the custom tile from the Band and is bound to the button labeled as such. IsListening is bound to the toggle switch, IsBusy is bound to the progress ring and the semi-transparent overlay that will appear while you switch the toggle, and the rest of the properties are just display properties.
There is a single call to the BandOperator - later we will see more. The public interface for a BandOperator is very limited, as are the interface for all the classes in this project:
And that is all you need to know from the BandOperator for this blog post.
MVVMLight aficionados like me might notice that our good friend RelayCommand is MIA. This is because in the XAML I use the new x:Bind syntax, as you might have seen in this StackPanel in MainPage.xaml that show most of the text being displayed:
This new way of binding allows to directly binding public viewmodel methods to events happening in the user interfaced, so we don't need a command anymore:
<Button Grid.Row="5" Click="{x:Bind ViewModel.RemoveTile}"
  Content="Remove tile from Band" HorizontalAlignment="Center"/>
Detailed information on how to bind events directly to events can be found here. In order to be able to use x:Bind, the object to bind to needs to be a public property of the code behind class. This you can see in MainPage.xaml.cs:
public MainViewModel ViewModel
{
  get { return MainViewModel.Instance; }
}
Starting and stopping As you can see from IsListening, there should be a Toggle method that is kicked off when the IsListening property is set. There is one indeed, and it - and it's friends - are implemented like this:
Start basically kicks the whole thing off. I have found out that unless you specifiy the Task.Delay(1), setting IsBusy does not have any effect on the UI. Once, and I am literally talking the previous century here, I used DoEvents() in Visual Basic (6, yes) that had exactly the same effect ;) - now you get to see the progress ring and the overlay on the rest of the UI. Both this viewmodel and the bandoperator are made to listen to incoming temperature events on the TemperatureListener, and that TemperatureListener is started then. The bandoperator can do with it whatever it wants. Then we start a 'background session' to keep the app alive as long as possible. Then the band operator is started - this will in effect create a tile and a user interface on the connected Band, if that is not already there, and the Band will be made to vibrate. The application is running now.
Finally, in the viewmodel's Listener_OnTemperatureDataReceived method the data is put on the phone's screen and then passed around in a message to interested parties
Stop, of course, neatly disconnects all events again and stops all the components.
Flow of events Summarizing: temperature data flows like this: TemperatureQueueClient.OnDataReceived -> TemperatureListener.OnTemperatureDataReceived -> MainViewModel.Listener_OnTemperatureDataReceived + Messenger + BandOperator.HandleNewTemperature
And commands to switch of the fan flow like this: BandOperator -> FanSwitchQueueClient.PostData
And the rest is done via data binding. How the BandOperator exactly works merits a separate blog post, that will end this series.
Keeping the app alive If you hit the ToggleSwitch that is labeled "Get temperature data" you will notice Windows 10 mobile asks you to allow the app to track your location. This is in essence a trick to keep the app alive as long as possible - as I said before, the code to make the Band UI work runs on your phone but only does so to as long as the app is running ( and not suspended). I use ExtendedExecutionSession to trick your phone to think this app is tracking location in the background and should be kept alive as long as possible.
I think using ExtendedExecutionSession was first described by my fellow MVP Morten Nielsen in this article. I also got some usage guidance on this from my friend Matteo Pagani. In this demo I am clearly misusing ExtendedExecutionSession, yet it kind of does the trick - the app is not suspended right away (as happens with a lot of normal apps) but is more or less kept alive, until the phone needs the CPU and/or memory and suspends it after all. So this trick only delays the inevitable, but for demo purposes it is good enough. A probably better way is described in this article by James Croft, which uses a DeviceUseTrigger.
The StartFakeGeolocator does nothing special but creating a Geolocator that listens to location changes but does nothing with it. Have a look at the sources in the demo solution if you are interested.
Suspend and resume If the suspend request then finally comes, I neatly shut down the BandOperator for if I don't, all kinds of errors regarding accessing of already disposed native objects pop up. But it also shows a message (that is, a toast) that, when tapped, can be used to easily restart the app again and then OnResume kicks in.
Upon resuming , I only need to restart BandOperator again (and a fake Geolocator for good measure).
BlinkBehavior As I already showed, TemperatureData is also broadcasted on the MVVMLight Messenger when it is received. This is for good reasons - I want the circle in the middle blink up in accent color when data is received. That is accomplished by a behavior listening to that very message:
using System.Threading.Tasks;
using Windows.UI.Xaml;
using Windows.UI.Xaml.Media;
using Windows.UI.Xaml.Shapes;
using GalaSoft.MvvmLight.Messaging;
using Microsoft.Xaml.Interactivity;
using TemperatureReader.ClientApp.Messages;

namespace TemperatureReader.ClientApp.Behaviors
{
  public class BlinkBehavior : DependencyObject, IBehavior
  {
    private Shape _shape;
    private Brush _originalFillBrush;
    private readonly Brush _blinkBrush =
      Application.Current.Resources["SystemControlHighlightAccentBrush"] as SolidColorBrush;

    public void Attach(DependencyObject associatedObject)
    {
      AssociatedObject = associatedObject;
      _shape = associatedObject as Shape;
      if (_shape != null)
      {
        _originalFillBrush = _shape.Fill;
        Messenger.Default.Register<DataReceivedMessage>(this, OnDateReceivedMessage);
      }
    }

    private async void OnDateReceivedMessage(DataReceivedMessage mes)
    {
      _shape.Fill = _blinkBrush;

      await Task.Delay(500);
      _shape.Fill = _originalFillBrush;
    }

    public void Detach()
    {
      Messenger.Default.Unregister(this);
      if (_shape != null)
      {
        _shape.Fill = _originalFillBrush;
      }
    }

    public DependencyObject AssociatedObject { get; private set; }
  }
}
It is not quite rocket science: listen to the DataReceivedMessage, and if one is received, set the color of the attached Shape (a circle in this case) to the accent color, then return it to it's original color. The effect can be seen in the video in the first post of this series.
Conclusion Quite a lot going on in this app, and then we haven't even seen what is going on with the Band. Yet, but using MVVMLight and neatly seperated components, you can easily wire together complex actions using simple patterns using interfaces and events. In the final episode of the series I will show you in detail how the Band interface is made and operated. In the mean time, have a look at the demo solution




 This may come as a surprise, but the Earth is not flat, yet every map since the beginning of map making pretends it is. This has various, mostly historical reasons, the most notable being the fact it's much easier to roll up a flat map of the of Earth's pieces you are interested in (or put a lot of them in a book) and take those along for the trip, than to lug around a true representation of the Earth - which most likely would contain a lot of details on stuff you don't need, and too little of the stuff you do. Yes kids, people used to lug atlases around, books with maps. They have the added bonus of never running out of battery.
 So a map needs (or needed) to be flat, which makes it necessary to put the outside of what is essentially a sphere on a flat surface. That cannot be done without some dire consequences. Peel an orange and try to make the outside a continuous flat surface - and you will understand what I mean.